


NET PowerMON
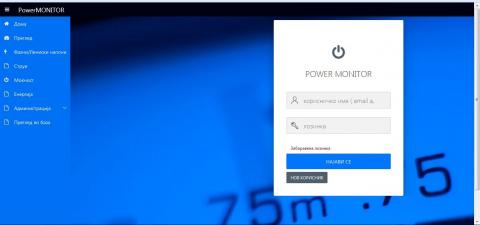
This online application provides review of all measurements in real time, whenever you are using the internet with PC, tablet, laptop or mobile device. It offers detailed view of all parameters of your energy management systems.
Possibility to track, generate alarms and reports for phase/line voltages, currents, power, energy, frequency, power factor etc, in Excel, pdf, HTML or direct e-mail with the report.

Real time view
NET PowerMON:
The general view panel offers numerical and graphical presentation of the measurements in real time. It is a fast and efficient way of checking and monitoring the parameters of interest.

Electrical power
NET PowerMON:
Review of maximum active power demand at 15-minute averaging interval, which is very important for industrial consumers. The numerical indicator for the maximum power demand is reset on the first day at the beginning of the month, and contains the maximal registered power demand and the time of occurrence.
Detailed raw review of active/reactive/apparent power with line graph and value markers.

Electrical energy
NET PowerMON:
Review of electricity energy consumption for given date, in 60 minutes with 15-minute interval, but also in 60 and 15 minute intervals separated.
Opportunity for different forecasts of planned electricity consumption, for example during weekend or in work day with two shifts. Comparison of forecast with real measurements.
Graph with markers of date and values of electricity consumption.
Intelligent alarms (through email) if the energy forecast trend is out of a predefined tolerance.
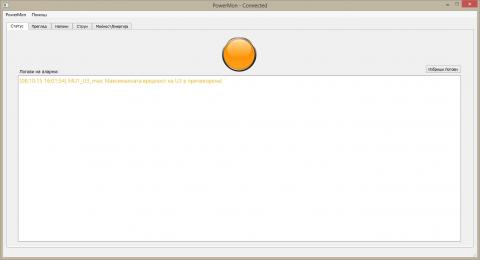
Intelligent alarms
PowerMON:
Possibility to define a logically connected “intelligent”, automatic alarms log generation, client notifications with easy-to-understand text messages locally or via email.
Possibility to define alarm category and alarm priority.
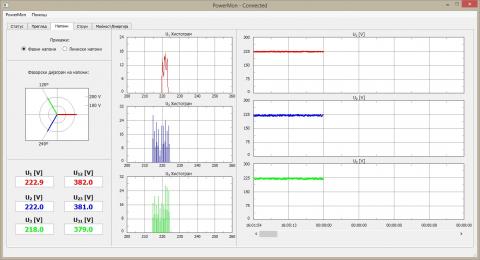
Table and graphic view
PowerMON:
Table and graphic presentation of all relevant parameters of electrical energy (vontage, current, power, energy, power factor, etc.). Voltage, current, and power phasor diagrams. Voltage and current hystograms.
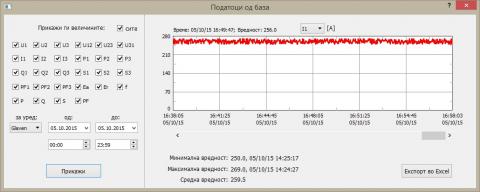
Data recording
PowerMON:
Automatic data recording in SQL database, statistical data analyses, data presentation and reporting.